Know where the line is losing its clearance before the plan is set.
Rail Vegetation Monitoring maps vegetation encroachment along the running line and the sighting distance to the signals on it, once a year, and hands you a register your contractor can work from.
- GSD
- ≤0.5 m (VHR)
- Cadence
- Annual
- Platform
- VHR satellite / aerial
- Spectral
- RGB + NIR
- 1Track
- 2Clearance zone
- 3Canopy line
- 4Encroachment
The job today
How the vegetation worklist gets built now
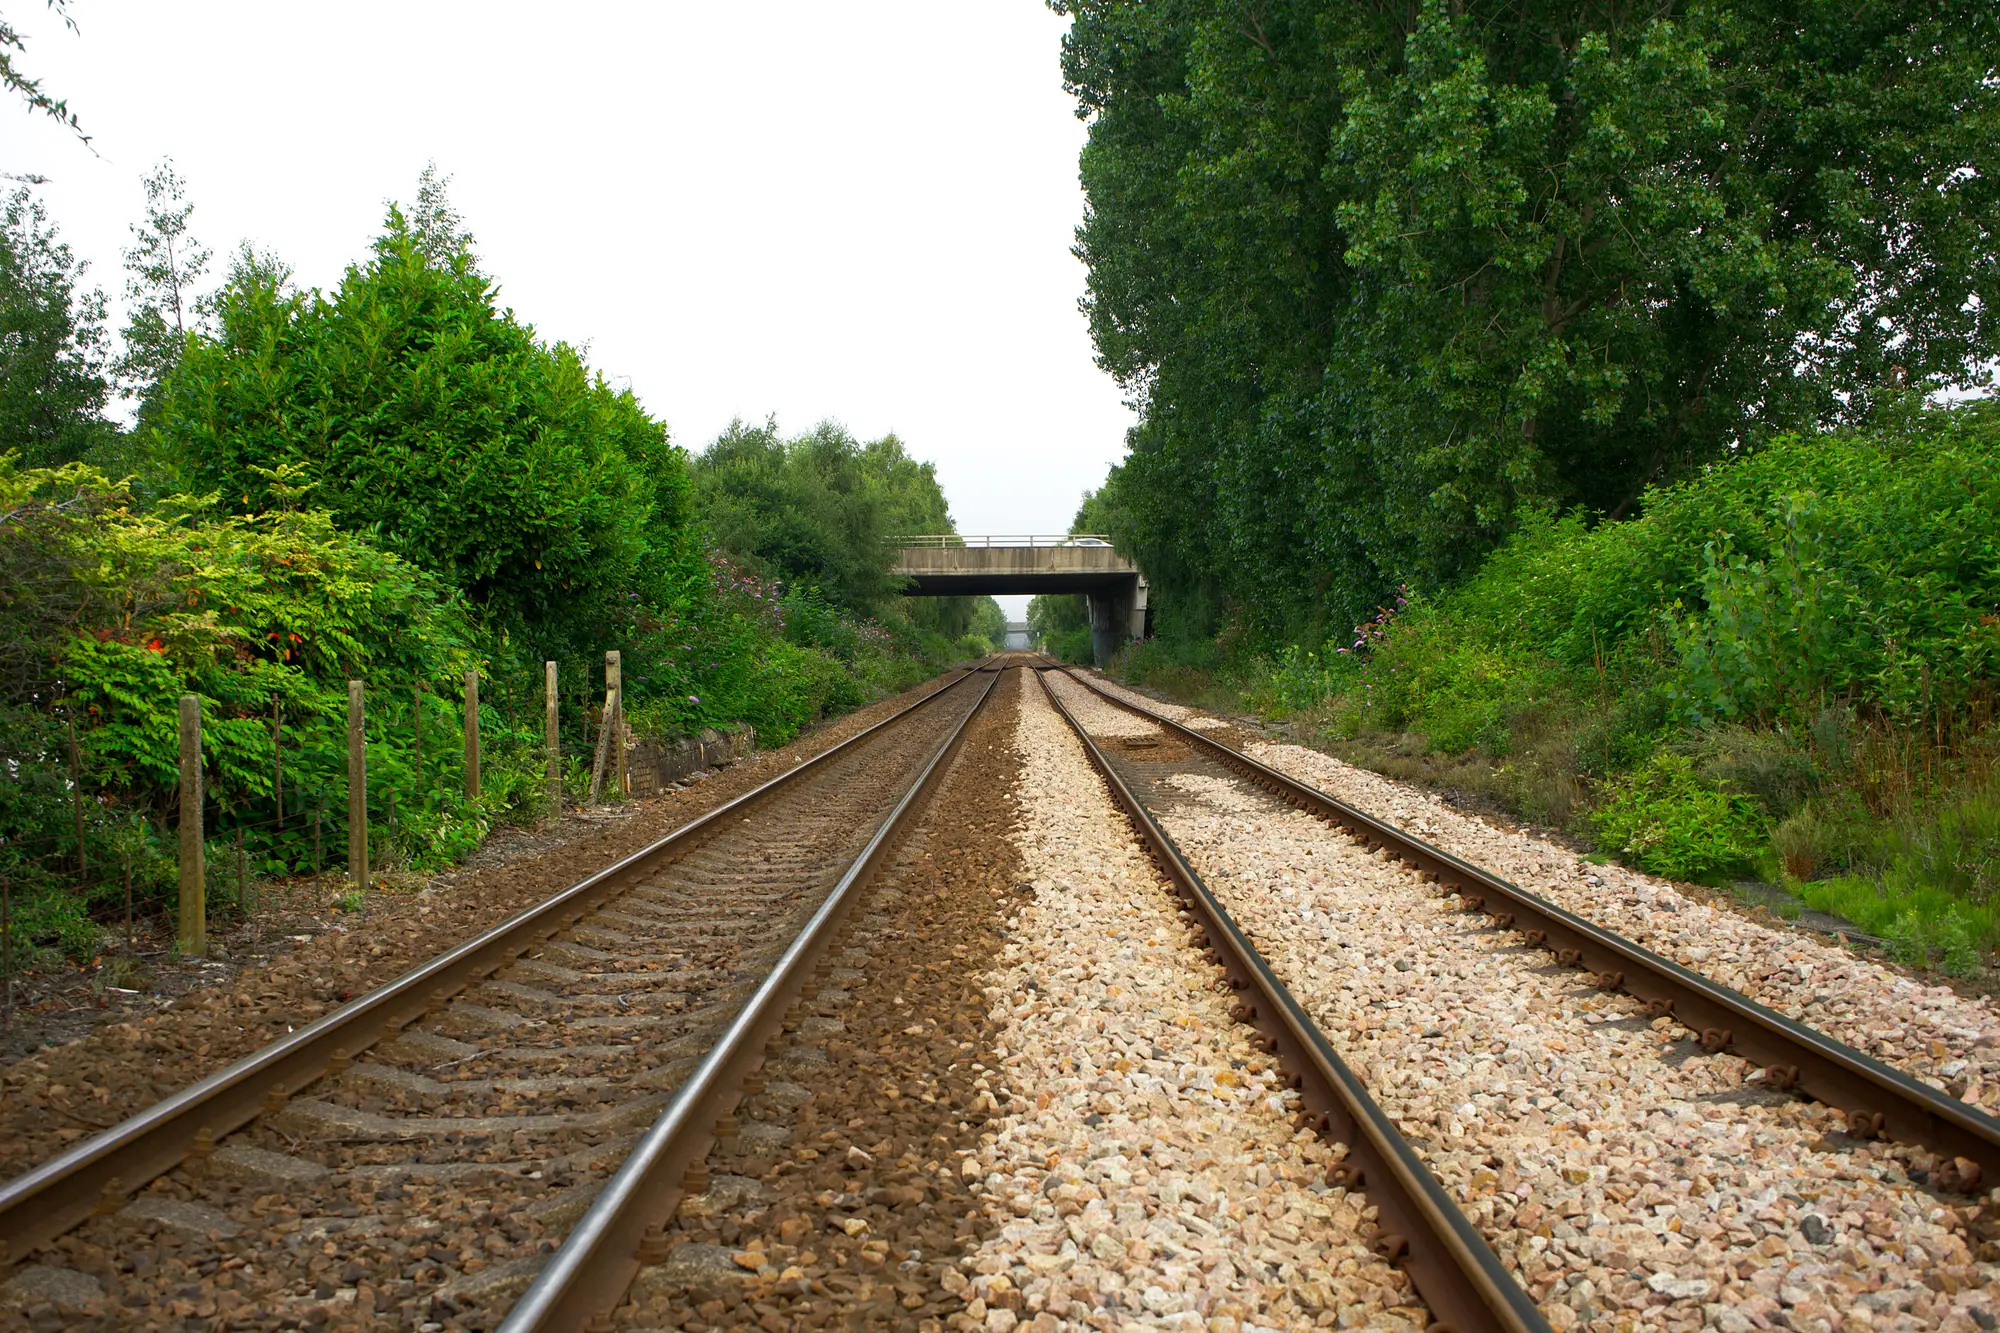
Lineside inspectors walk the route, or ride the cab, and write down what they see: a tree leaning over the track here, undergrowth closing into the clearance zone there, a signal that has lost some of its view. Those notes become a worklist for the vegetation-management contractor, and the worklist feeds the annual plan.
It works well for the stretch in front of the inspector. The trouble is the rest of the route. A walk only covers so much ground before the plan is fixed, so the order contractors visit in follows what got reported: the branch that came down, the driver who rang about a signal. A cutting that quietly closed in over two seasons has nobody's name on it until it becomes a report.
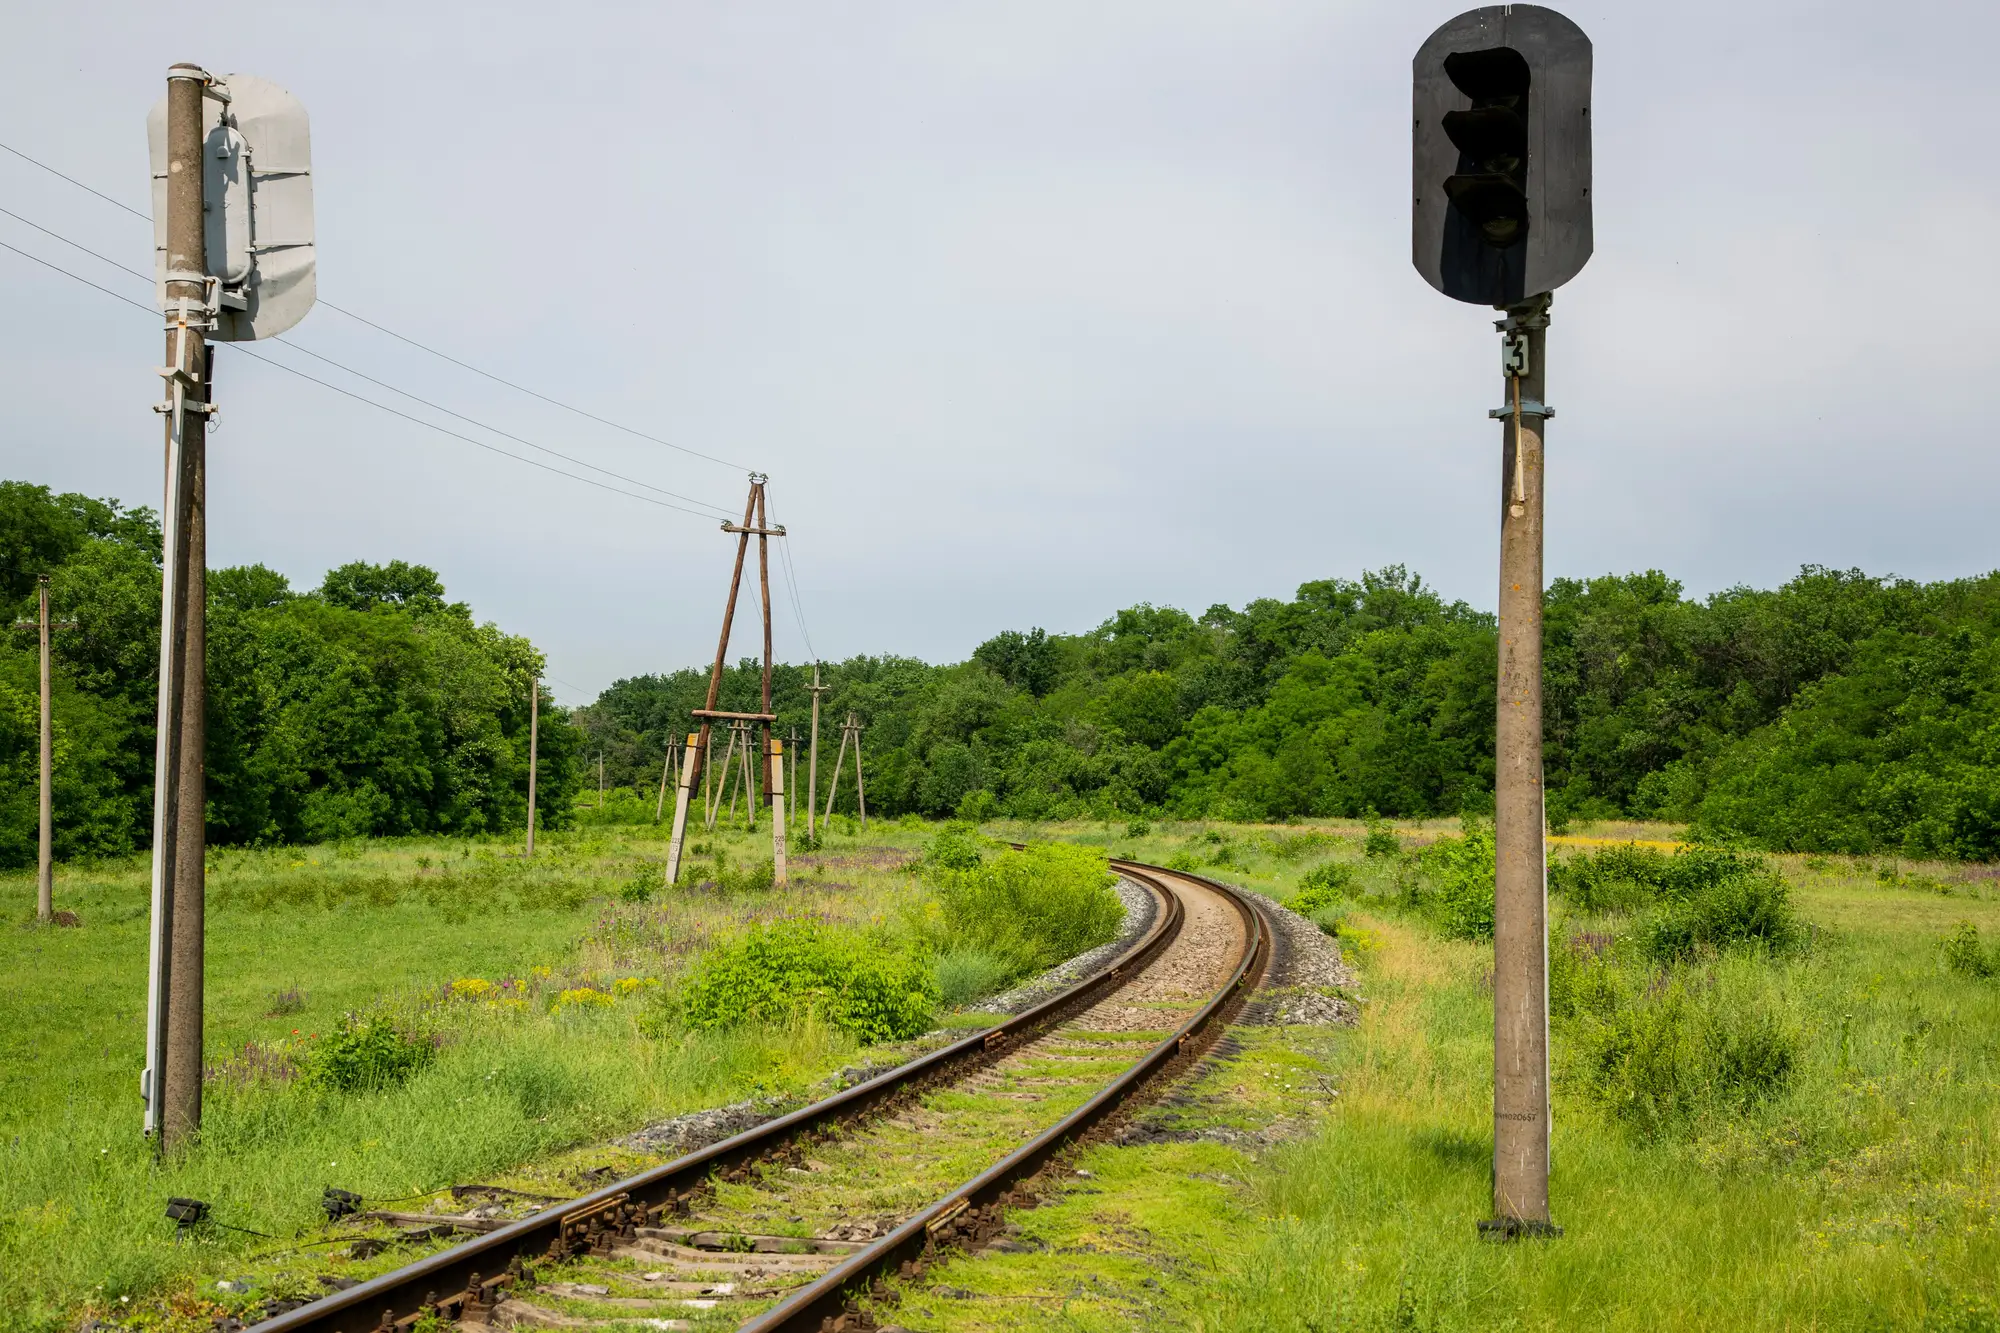
The sighting question is harder still. A signal loses its view gradually, and from the cess it looks much as it did last year. Between inspection cycles it can be hard to point to a record of when the canopy edge moved.
This register gives you one picture of the whole corridor, once a year, before the plan is set. The inspector's walk stays. What changes is that the walk goes to the places the register says to look first.
What you get
What the register holds
- 2.1
Chainage register
Table, CSVOne row per encroachment location, in chainage order: where it is, whether it is canopy over the track or undergrowth in the clearance zone, and its distance to the track. One delivery per annual pass, ready to hand to the contractor.
- 2.2
Signal sighting flags
Table, CSVEach signal with reduced sighting distance is flagged, read from the mapped canopy edge along the approach. This is geometry from imagery. It is a list of signals to go and look at, not a sighting survey.
- 2.3
Corridor overlay map
GeoPackage or ShapefileThe encroachment locations and flagged signals as a layer over the corridor, for QGIS or ArcGIS and for the vegetation-management crews who work from a map.
How it works
Define the corridor
You send the route: a centreline or boundary, and the signal positions if you keep them. We agree the extent with you.
Annual pass
We pick the clearest RGB+NIR VHR pass of the season over the corridor, timed to your plan.
Segment and measure
Vegetation is segmented and measured against the clearance zone. NIR helps tell vegetation type and vigour apart from other dark surfaces.
Register delivered
The chainage register, the signal flags and the overlay map arrive together. We go through the top of the list with you.
Where it fits
Where it fits in your workflow
For the annual vegetation management plan
Use the register to rank segments before the plan is fixed. It tells the contractor which stretches to visit first and gives the signalling engineer a dated record to look at between inspection cycles. Your inspector walks the top of the list, makes the call on what to cut, and the plan follows from that.
Limits
- L01
Resolution floor
At 0.5 m a pixel is wider than a branch. Tree crowns and thick scrub are mapped as areas. Individual stems, thin overhanging boughs and low ground cover at the foot of an embankment are read as patches or missed.
- L02
NIR does not see through canopy
NIR separates vegetation from other surfaces and helps with type and vigour. It does not show what is under a closed canopy. Anything beneath trees is mapped from the canopy edge.
- L03
Sighting flags are not a survey
Reduced sighting distance is flagged geometrically from the mapped canopy edge. It does not replace an engineering sighting check on the signal.
- L04
Clear-sky window
Optical imagery needs a clear day. A cloudy season can push the pass later, and leaf-off winter imagery shows a different canopy edge from summer.
- L05
Once a year
One pass a year. Storm damage or a fast-growing stretch shows up in the next pass. Event-driven re-flights are not part of this offer.
- L06
Not a ground walk
The register ranks where to look. It does not replace the inspector's walk or the person deciding what to cut.
Who it's for
For
- Infrastructure managers and lineside asset managers who own the vegetation management plan
- Signalling and route asset engineers who need a dated view of signal sighting
- Vegetation inspectors and contractor supervisors working from a worklist
Not for
- Teams that need a certified sighting survey or a compliance certificate
- Teams who want monthly or live monitoring of the corridor
- Vegetation under a closed canopy, or individual stems and boughs
- Powerline, pipeline or road corridors
FAQ
Questions before a project
Does NIR let you see through canopy?
No. NIR helps tell vegetation type and vigour apart. It cannot see under a closed canopy.
How precise is the sighting-distance flag?
It is a geometric flag from the mapped canopy edge. It marks signals worth checking on foot. It is not an engineering sightline survey.
Does this replace the ground walk?
No. It tells your inspectors where the walk is most needed.
Can you go more often than annual?
Annual is the cadence this is built for. Re-flights after storm damage are not part of this offer.
How do we check it against our own records?
Pick a stretch your inspectors walked recently and compare their notes with the register for the same chainage. Decide for yourself whether the ranking is good enough to plan with.
Will it load into our systems?
It comes as a table or CSV in chainage order and a GeoPackage or Shapefile overlay, so anything that reads a GIS layer or a spreadsheet can take it. We don't write into your asset system.
What do you need from us to start?
The route as a centreline or boundary, and signal positions if you hold them. Tell us when your vegetation management plan is set and we will say whether the imagery calendar can meet it.
Who owns the results and the imagery?
Ownership and licence terms are written into the project agreement before anything is ordered. If your legal team needs to see them, ask early.
How is a project priced?
The quote depends on the length of corridor and the imagery source, and we price it for your route. No figure is quoted on this page.
Register your corridor before the plan is set.
Tell us which line you would start with and when the vegetation management plan is fixed.
Start a project